niccokunzmann/python-recurring-ical-events
Data sources
| Repository | Pull requests | Issues | Complete | Read |
|---|---|---|---|---|
| niccokunzmann/python-recurring-ical-events | 176 / 176 | 123 / 123 | 100% | 1 day, 3 hours ago |
Download the data behind this page. The ODS spreadsheets also have the data each table was made from, and what the download is.
- response times: ODS, CSV, Parquet, JSON
- pull requests and issues: ODS, CSV, Parquet
- comments and reviews: ODS, CSV, Parquet
- commits: ODS, CSV, Parquet
- contributors: ODS, CSV, Parquet
How to check the numbers with scipy.
Sources shown
Response times
Time until the first response of each class of people (edit classes). The author's own comments do not count. Measured, normal and exponential use only the items that got a response; Kaplan-Meier counts the others, too, as waiting at least until they were closed or until now, and is "-" where less than half (or 95 %) got a response.
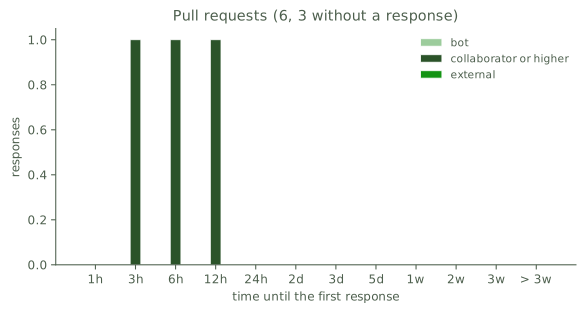
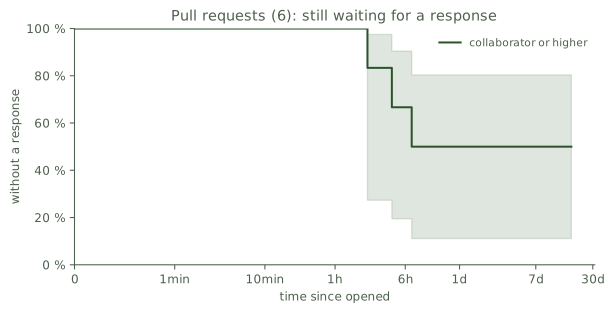
| class | n | fit | average | std error | median | 95% |
|---|---|---|---|---|---|---|
| collaborator or higher | 3 | measured | 4h 32min | 1h 23min | 4h 16min | 6h 47min |
| collaborator or higher | 3 | normal | 4h 32min | 1h 8min | 4h 32min | 7h 46min |
| collaborator or higher | 3 | exponential | 4h 32min | 2h 37min | 3h 9min | 13h 36min |
| collaborator or higher | 6 | Kaplan-Meier | - | - | - | - |
n counts the items with a response of the class. Kaplan-Meier counts all items, so its n is the same for every class: the items without a response of the class count as waiting, until they were closed or until now. How to read the response times
Trend: too few responses to tell whether they get faster or slower. How the trend is computed
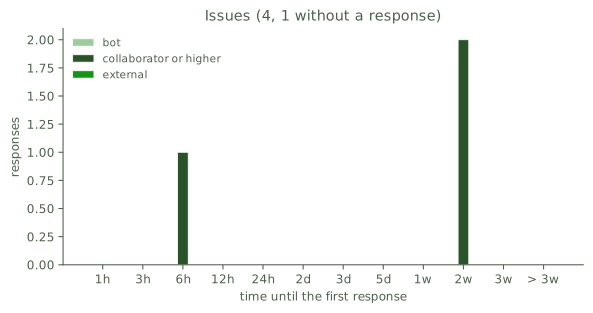
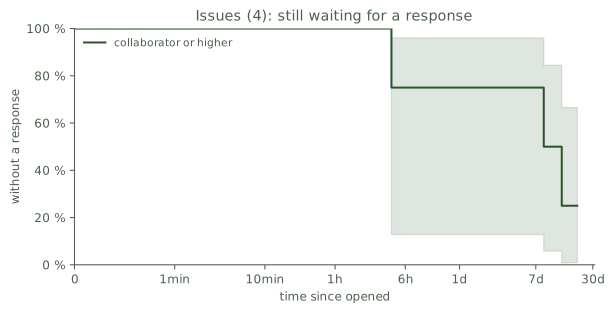
| class | n | fit | average | std error | median | 95% |
|---|---|---|---|---|---|---|
| collaborator or higher | 3 | measured | 7d 10h | 3d 21h | 8d 13h | 13d 1h |
| collaborator or higher | 3 | normal | 7d 10h | 3d 4h | 7d 10h | 16d 13h |
| collaborator or higher | 3 | exponential | 7d 10h | 4d 7h | 5d 3h | 22d 7h |
| collaborator or higher | 4 | Kaplan-Meier | - | - | 8d 13h | - |
n counts the items with a response of the class. Kaplan-Meier counts all items, so its n is the same for every class: the items without a response of the class count as waiting, until they were closed or until now. How to read the response times
Trend: too few responses to tell whether they get faster or slower. How the trend is computed
Badges
Embed the response time in a README. The badge counts with the default classes of people. The badge shows what is in the database and never calls GitHub. Parameters: kind = pr or issue, percentile = 0-100, class = a class name (optional), model = measured, normal, exponential or kaplan-meier (optional), label = the text of the left side (optional).